./run runpod-fatto-in-casa-due-h200-rename-gateway
A silent rename, half the apps at 404: home-made RunPod on two H200s
I rebuilt the RunPod + Weights & Biases experience for a small team on two H200s, on top of Slurm. Then a model rename broke everything silently.
- status
- shipped
- project
- hpc
- updated
- 2026-07-08
- tags
One Tuesday the reports came in: the OCR app was answering 404, the voice service was dead, an NER backend errored on every call. Nobody had touched those apps in weeks. The culprit was upstream: weeks earlier I had renamed the models served by the gateway — from the internal aliases to their real Hugging Face names — and every app that had the old alias hardcoded had slammed into a model that no longer existed. No crash, no glaring red log: just a polite, silent 404, repeated for days.
This journal starts there, but the bigger story is what was underneath: having rebuilt, for a small team and a couple of GPUs, the experience you usually pay RunPod and Weights & Biases for.
The idea
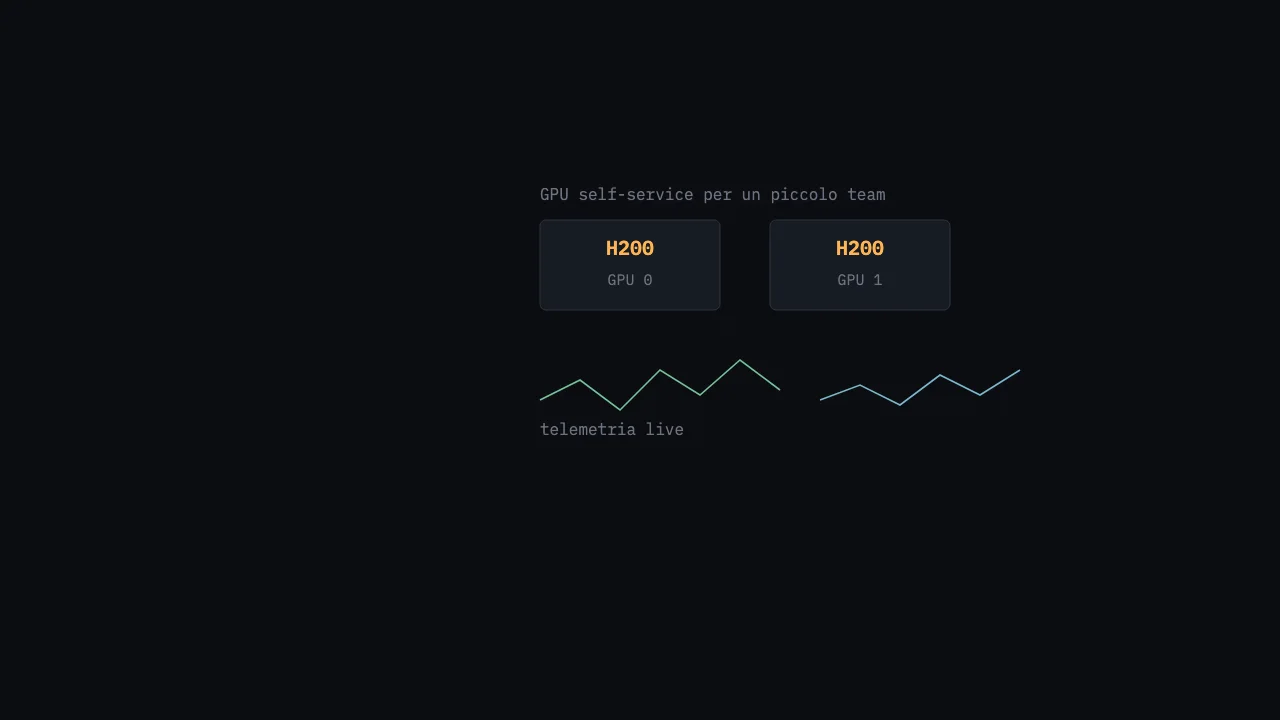
The team needs self-service GPUs: grab a card from the browser, open a notebook, launch a fine-tuning run, watch the loss in real time, serve a model via API. The stuff RunPod and W&B give you ready-made. But here there’s a single node with two H200 NVL (~140 GB each, driver 595.71.05, CUDA 13, RHEL 10.1) and six users. Too little to justify a cloud platform, too much to manage by hand over SSH.
The fundamental choice: don’t rewrite the scheduler. Slurm was already running on the node (cluster atlas, Gres=gpu:h200:2,shard:h200:28, 1 TB of RAM, 128 CPUs). Slurm stays the allocator; I built the UX on top of it.
Architecture: one entrance, everything on localhost
The telemetry and web plane runs in Podman (5.6, systemd quadlet), all bound to 127.0.0.1; the only entrance is the edge tunnel. Firewalld keeps only 22 and 443 open.
- Telemetry (the RunPod tab clone): the key piece is NVIDIA’s DCGM exporter, which exposes exactly what you see on RunPod — per-GPU util, VRAM used/total, temperature, power, clocks:
# /etc/containers/systemd/dcgm-exporter.container
[Container]
Image=nvcr.io/nvidia/k8s/dcgm-exporter:3.3.9-3.6.1-ubuntu22.04
PublishPort=127.0.0.1:9400:9400
PodmanArgs=--device nvidia.com/gpu=all   # GPU access via CDI (nvidia-container-toolkit)
Alongside: node_exporter (CPU/RAM/disk) and a slurm_exporter (queue, jobs per user, GPU-hours — the piece RunPod doesn’t have but that you need in multi-user). Prometheus scrapes them, Grafana renders: five dashboards, one of which is a literal copy of RunPod’s telemetry panel.
-
Experiment tracking (the W&B clone): MLflow with a PostgreSQL backend. The nice part is that the HF
Trainerlogs to it without a single line of code — just two environment variables andreport_to="mlflow". From there cometrain/loss,train/learning_rate,train/grad_norm… exactly the fields you see in the W&B screenshot. -
Portal (the Deploy/Connect clone): here’s where the first gap between my design documents and reality showed up. I had designed Open OnDemand. Too bad OOD has no packages for RHEL 10. I fell back on the JupyterHub + SlurmSpawner already present, adding a RunPod-style resource selector with
wrapspawner.ProfilesSpawner:
c.ProfilesSpawner.profiles = [
    ("1× H200 — 8h (default)", "gpu1_8h", "batchspawner.SlurmSpawner",
        dict(req_partition="gpu", req_runtime="8:00:00", req_memory="64gb",
             req_nprocs="16", req_options="--gres=gpu:1")),
    ("2× H200 — 4h (training multi-GPU)", "gpu2_4h", "batchspawner.SlurmSpawner",
        dict(req_partition="gpu", req_runtime="4:00:00", req_memory="128gb",
             req_nprocs="32", req_options="--gres=gpu:2")),
    ("Shard GPU ~½ — 6h (notebook leggero)", "shard_6h", "batchspawner.SlurmSpawner",
        dict(req_partition="interactive", req_runtime="6:00:00",
             req_options="--gres=shard:7")),
    ("Solo CPU — 8h", "cpu_8h", "batchspawner.SlurmSpawner",
        dict(req_partition="cpu", req_runtime="8:00:00", req_options="")),
]
You pick a profile from the dropdown, JupyterHub submits a Slurm job that launches the notebook on that budget. It’s RunPod’s “pick a GPU / deploy”, but behind it there’s a real scheduler allocation. SSO arrives at the edge level (a header with the authenticated email) mapped to the unix user — so SlurmSpawner launches jobs with the right identity.
The catch: the gateway that renamed itself
On top of everything sits an OpenAI-compatible model gateway: a service that holds a catalog of LLMs, loads them on-demand onto Slurm at the first request, unloads them after an idle_timeout to free the GPU, and acts as a single API for everyone. The MLflow registry today holds 53 models: 15 served by the gateway (tag served_by=gateway, alias @production), 38 cataloged on disk.
On June 17 I did something that looked clean: I removed the fake internal aliases (svc-ocr, svc-tts, …) and had the models served under their real Hugging Face names. Order, consistency, less indirection. Except the client apps had those aliases hardcoded. Hence the silent 404.
The real lesson isn’t “don’t rename”. It’s that there was no source of truth for which model each app calls. I had to reconstruct it from the ground up, reading the gateway’s usage_log — who called what and by which name:
SELECT model, count(*), sum(CASE WHEN status_code>=400 THEN 1 ELSE 0 END) AS errori
FROM usage_log GROUP BY model;
The rows with high errori and a model name that was no longer in the catalog were my victims. The fix, applied case by case, was to remove the hardcoded alias and read it from an environment variable, with a default on the real name:
OCR_MODEL = os.environ.get("OCR_MODEL", "dots.ocr") # no more alias buried in the codeThen I wrote a small read-only Prometheus exporter that scrapes /v1/models (live state) and the usage_log (requests, errors, tokens, latency per model and per user), so on Grafana you can see which model is running and how it’s being used. The next rename 404 I’ll catch on a dashboard, not from a colleague’s email.
Honest gotchas
- README vs reality: the design documents say “Open OnDemand” and “nginx as the single entrance”. Reality is JupyterHub and a tunnel that goes straight to the services’ ports. I left an
AS-BUILTfile that, where it diverges from the design, wins. - An exporter must bind
0.0.0.0, not127.0.0.1, because the Prometheus in a container reaches it viahost.containers.internal. Firewalld keeps the port off the edge anyway. Small thing, half an hour lost. - One GPU, a 130 GB LoRA: serving a LoRA adapter that takes up ~130 of the 140 GB means that, while it runs, it unloads the other models. On a single node this is unavoidable, but it has to be told to users.
- MLflow has no native auth: security is all at the perimeter. Port
:5000must never leave localhost + vhost. - The rename killed a service with no replacement: the voice service’s TTS model was uninstalled in the same round. It’s not a one-line fix: the gateway now has no TTS model at all, and which one to install has to be decided first. It stays broken, and it’s fine to admit it.
How it’s going
Shipped and in use: telemetry, MLflow with eval-gated @production promotion and hot-reload (the gateway re-resolves the production alias at every model start, promotion without restart), JupyterHub with the resource selector, daily Postgres backup. In progress: restoring the voice service (blocked on the TTS model choice) and per-user GPU-hour quotas, deliberately deferred.
What I learned
That the most fragile piece of a platform isn’t the GPU or the scheduler: it’s the names. A rename that on paper is “cleanup” becomes a distributed incident if you don’t have a registry of who-calls-what. The telemetry I added afterward wasn’t there to show the hot GPUs — those were already visible. It was there to make the invisible visible: the app→model map that, as long as everything works, nobody looks at. Next time that registry exists before the rename, not after the first 404.
grep -rl 'same thread' ~/lab
I was about to buy a GPU. I priced the entire rental market and changed my mind.
Technical journal: I priced the entire cloud GPU market (RunPod, Vast.ai, Lambda, Modal) to figure out when renting beats buying. The headline price…
The IT department that argues with itself: three layers and a human in the loop
An IT department made of AI agents — NOC, SOC, SRE, Architecture Board — that watch a k8s cluster, rebut each other and prepare decisions for a…
Kochab: building trust into code — the star that never deletes
Technical diary of Kochab: an outbound-only agent in Go, a security audit mapped to CIS/NIST, Ed25519-signed tasks, and one rule — it never deletes — guaranteed…